Inspector
Role
The Inspector module runs two independent analyses on a star field. Each can be enabled separately — none, one, the other, or both at once:
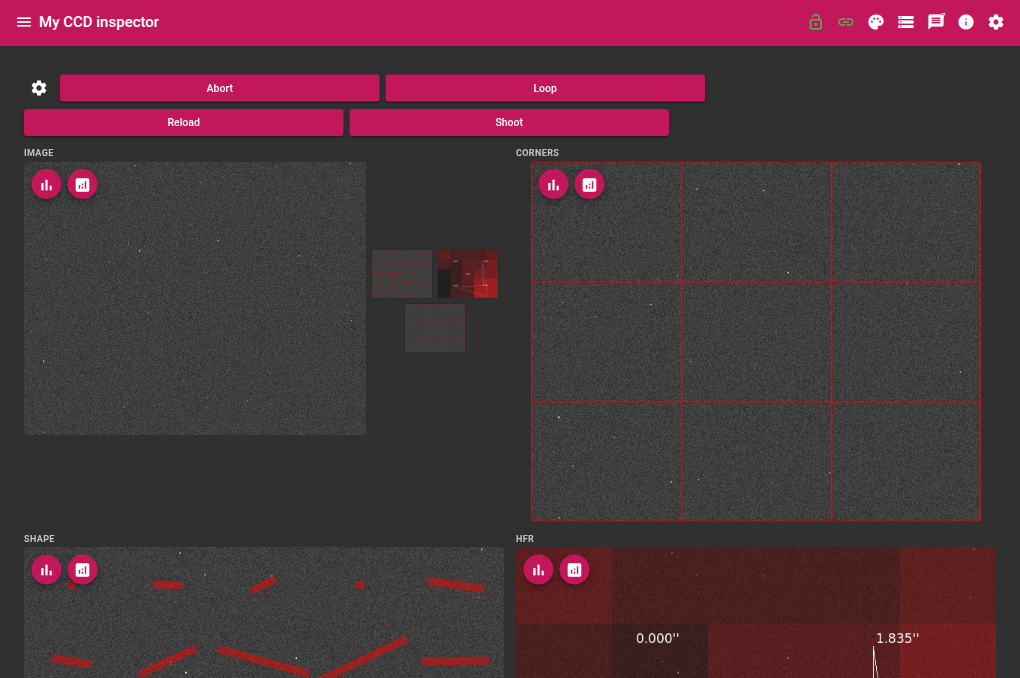
- Inspector analysis — optical quality across the whole image, on a focused frame. It produces three complementary maps (HFR by zone, star elongation, corner mosaic) used to diagnose optical defects such as tilt, coma or field curvature.
- Collimator analysis — optical collimation (mirror alignment) of Newtonian, RC (Ritchey-Chrétien) and SC (Schmidt-Cassegrain) telescopes, on a defocused frame. It analyses the whole star field, continuously displays the collimation error and the per-screw corrections. Semi-manual: the software defocuses, captures and analyses in a loop while the user physically adjusts the (non-motorized) collimation screws and watches the visual feedback update in near real time.
Analysis can be performed on an image acquired live from the camera, or on a FITS file loaded from disk.
Required devices
| Device | Role |
|---|---|
| Camera | Image acquisition (optional if loading from file) |
| Focuser (optional) | Automatic defocus control for the collimation workflow, plus the “home” position feature. If absent, defocus manually before each capture |
Analysis selection
| Toggle | Effect |
|---|---|
| Inspector analysis | Run the HFR / shape / corner analysis on each captured (or reloaded) frame |
| Collimator analysis | Run the collimation analysis on each captured (or reloaded) frame |
The two toggles are independent (not mutually exclusive) and are persisted with the module profile. When an analysis is switched off, its result images are cleared so a stale map is never shown next to a fresh one from a different frame.
Parameters
Acquisition
| Parameter | Description |
|---|---|
| Exposure | Exposure duration in seconds |
| Gain | Camera gain |
| Offset | Camera offset |
| Focal length | Optical focal length in mm — used to convert HFR values and the collimation vector to arcseconds |
| Corner size (pixels) | Width in pixels of the patches extracted for the corner mosaic |
Analysis
| Parameter | Description |
|---|---|
| Zoning | N×N grid for per-zone analysis (from 1×1 to 64×64) |
Collimation detection
These parameters bound and tune donut detection for the collimation analysis (see “Per-star detection” below) — defaults are meant to work out of the box, only adjust if needed.
| Parameter | Default | Description |
|---|---|---|
| Min. std dev (ADU) | 20 | Below this, the frame is considered flat (overexposed, underexposed, no donut) and the collimation analysis is skipped entirely for that capture |
| Max candidate size (% of frame) | 5 % | A contour larger than this fraction of the frame is rejected outright (never a real donut — typically a saturation artifact) |
| Detection sensitivity margin (0-255) | 5 | Minimum local contrast required for a pixel to be considered part of a donut. Lower it to pick up fainter/lower-contrast donuts (at the risk of catching more noise — already bounded by the other parameters here) |
| Detection locality (divisor) | 8 | Controls the size of the local analysis window (frame size / N). Raise it (smaller, more local window) to also help detect faint donuts sitting against a slightly uneven background |
| Min. candidate radius (pixels) | 5 | Rejects candidates too small/point-like to be a real defocused donut — keeps a field that isn’t defocused enough (near-point stars) from polluting the collimation fit with noise |
Defocus
| Parameter | Description |
|---|---|
| Focuser offset (steps) | Focuser displacement (in steps) applied by Go intra / Go extra to reach the defocused position |
Output maps (inspector analysis)
HFR map
The HFR map divides the image into an N×N grid (according to the Zoning parameter). For each zone, the average HFR is computed from all detected stars, then smoothed using an 8-neighbour average.
Each zone is colour-coded from green (best HFR) to red (worst HFR).
Overlaid on the map:
- Blue circles around each detected star, with radius proportional to the individual HFR
- A white quadrilateral connecting the centres of the four quadrants, whose shape reflects the HFR distribution — a perfect square indicates ideal uniformity
- HFR value for each quadrant (top-left, top-right, bottom-left, bottom-right) and overall HFR, expressed in arcseconds
Shape map (aberrations)
The shape map analyses star elongation per zone. For each zone in the grid, a line segment is drawn:
- Orientation: direction of the stars’ principal axis (mean angle)
- Length: proportional to the elongation
a/b − 1(major axis / minor axis ratio)
Short, uniform segments across the image indicate round stars. Long segments at the edges signal coma or astigmatism.
Corner mosaic
The mosaic assembles nine patches of size Corner size extracted from nine positions of the original image, arranged in a 3×3 grid:
Top-left    |  Top-centre    |  Top-right
Mid-left    |  Centre        |  Mid-right
Bot-left    |  Bot-centre    |  Bot-right
This view allows direct comparison of star quality at the centre and edges of the field.
Collimation analysis
A defocused star appears as a ring (“donut”) whose shape and centering reveal the collimation state. Unlike a classic approach comparing a single star between intra-focal and extra-focal positions, the collimation analysis uses every usable star in a single field, from a single capture:
- Defocus (automatic via the focuser, or manual)
- Capture of an image containing several stars spread across the field
- Detection of each usable donut and computation of a deformation vector per star
- Regression over all the vectors to determine the global collimation vector
- Conversion into a correction to apply on each of the 3 screws
- New capture, new analysis, continuous loop until convergence
Why the full field is enough
For a star at position P in the image (frame centered on the image), the observed deformation vector follows a linear model:
D(P) = C - k·Pwhere C is the collimation vector being sought (constant, independent of the position in the field) and k groups the effect of field coma (a normal optical aberration, present even when well collimated, that grows with distance from the center and with the telescope’s aperture speed). Such a vector field always has a single convergence point — with a few stars at different field positions, a regression separates the collimation part from the coma part, with no need to compare intra- and extra-focal.
The Go intra/Go extra buttons remain available for a manual check by the user, but this is not a step in the automated loop.
Per-star detection
For each detected star:
- Local adaptive thresholding, then refined individually per star (a single global threshold would penalize the faintest stars in the field)
- Extraction of the ring’s outer contour and of the secondary’s shadow (if visible)
- A least-squares circle fit on the outer contour gives the star’s theoretical center — this method stays reliable even when the ring is heavily distorted (a crescent shape, in case of severe decollimation)
- The deformation vector is the offset between this theoretical center and the intensity-weighted centroid of the ring (shadow excluded)
Donuts visibly present in the frame but left undetected point to a threshold that’s too strict (lower Detection sensitivity margin, or raise Detection locality). Conversely, a field that isn’t defocused enough (near-point stars rather than real rings) carries no usable deformation signal — Min. candidate radius makes sure such a field cleanly falls into “not enough donuts detected” instead of producing a noisy fit and a bogus convergence point. See “Collimation detection” in the parameters above.
Regression and convergence point
The deformation vectors of all detected stars are least-squares fitted to the D(P) = C - k·P model. The resulting vector C is converted to arcseconds (using the focal length and sensor pixel size), then projected onto the 3 collimation screws at 120° to get a sign and an amplitude per screw.
The per-screw amplitude is expressed in arcseconds, not in turns or fractions of a turn. The relationship between an optical error and a physical screw movement depends on the secondary’s mechanical mount (thread pitch, sensitivity), which is specific to each instrument — rather than inventing an approximate calibration, adjustment is done by feel: the displayed amplitude and direction give the trend, the user adjusts and watches the live update.
Collimation map
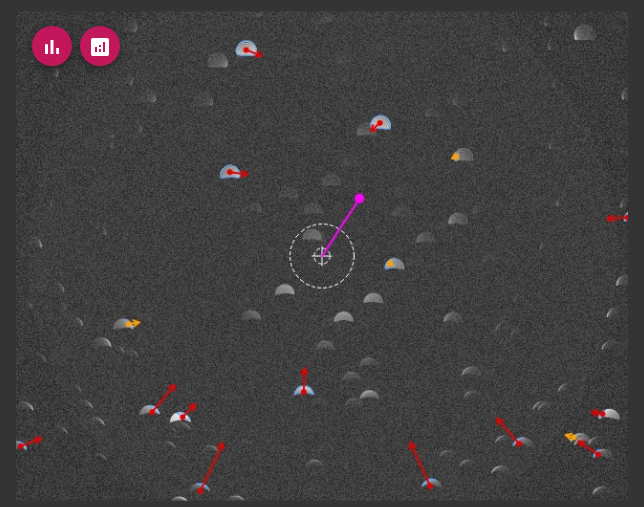
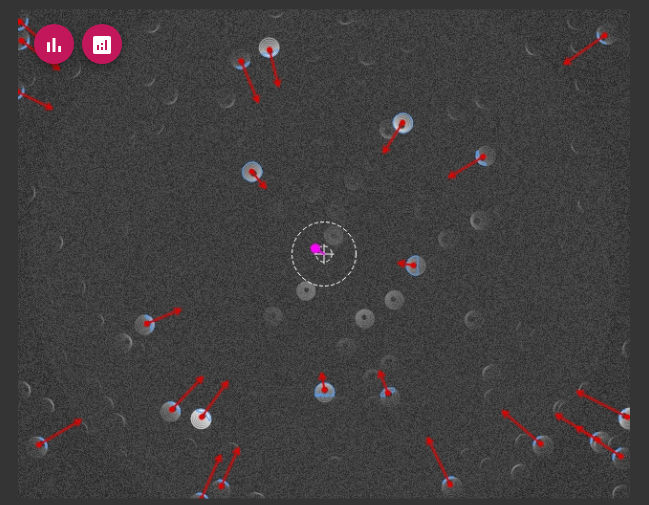
The collimation analysis publishes its own annotated image (the main image stays a raw frame). It includes, for each detected star:
- The donut’s outer contour
- A deformation arrow (exaggerated to stay visible), colour-coded by amplitude (green / orange / red)
And for the whole field:
- A bullseye (dashed rings) centered on the image, using the same tolerance thresholds as the quality light
- A line connecting the image’s theoretical center to the computed convergence point — absent if the fit is deemed unreliable (convergence point extrapolated too far outside the frame, a sign of an under-defocused field or too few usable donuts)
Before collimation (example)
After collimation (example)
Collimation live values
Collimation vector
| Value | Description |
|---|---|
| C.x / C.y (px) | Collimation vector, in image pixels |
| Amplitude (arcsec) | Collimation vector amplitude, converted to arcseconds |
| Convergence point x/y (px) | Computed convergence point (where the deformation vectors, extended, cross) |
| Quality | Light: green for a small amplitude, orange in the intermediate zone, red above the high threshold |
Per-screw corrections
| Value | Description |
|---|---|
| Screw 1 / 2 / 3 (turns) | Correction amplitude and direction per screw, expressed in arcseconds (positive = tighten) — fixed 120° convention, no automatic detection of the screws’ actual orientation |
Detected stars
Grid listing every usable star from the latest analysis: position (x, y) and deformation vector (dx, dy) in pixels.
States
| State | Description |
|---|---|
| Idle | Module inactive |
| Shooting | Image acquisition in progress |
| Analyzing | Analysis in progress |
Focuser home
Set home records the focuser’s current absolute position; Go home then drives the focuser back to it. The position is not read at start-up and not persisted — nothing guarantees the focus is even roughly set at that point, so it must be set explicitly. The Focuser home property shows whether a home is defined and its value; until Set home has been used, Go home only logs a warning and does nothing.
Loading from file
The Select a file field lets you load a FITS file from disk and analyse it without triggering an acquisition. Analysis starts automatically when the path is entered, following the current Analysis selection.
Actions
| Action | Description |
|---|---|
| Shoot | Acquires a single image and runs the enabled analyses |
| Loop | Continuous acquisition and analysis — repeats automatically until stopped |
| Stop | Stops the continuous loop |
| Reload | Reloads and re-analyses the last image or file |
| Set home | Records the focuser’s current position as the home to return to |
| Go home | Moves the focuser back to the recorded home position (warns if none was set) |
| Go intra | Moves the focuser to the intra-focal position (manual check) |
| Go extra | Moves the focuser to the extra-focal position (manual check) |
The Go intra / Go extra / Go home buttons stay pressed while the focuser is moving, and are released when it reaches the target.