Focuser
Role
The Focuser module provides automatic telescope focusing. It moves the motorized focuser across a range of positions, measures star size (HFR — Half Flux Radius) at each point, then computes the optimal position using a degree-2 polynomial fit. With zoning enabled, it also produces a sensor tilt map.
Interface
The interface displays the HFR curve being built in real time, the sequence progress, and the final results (HFR and position). Parameters are accessible via the Parameters button in the top-right corner.
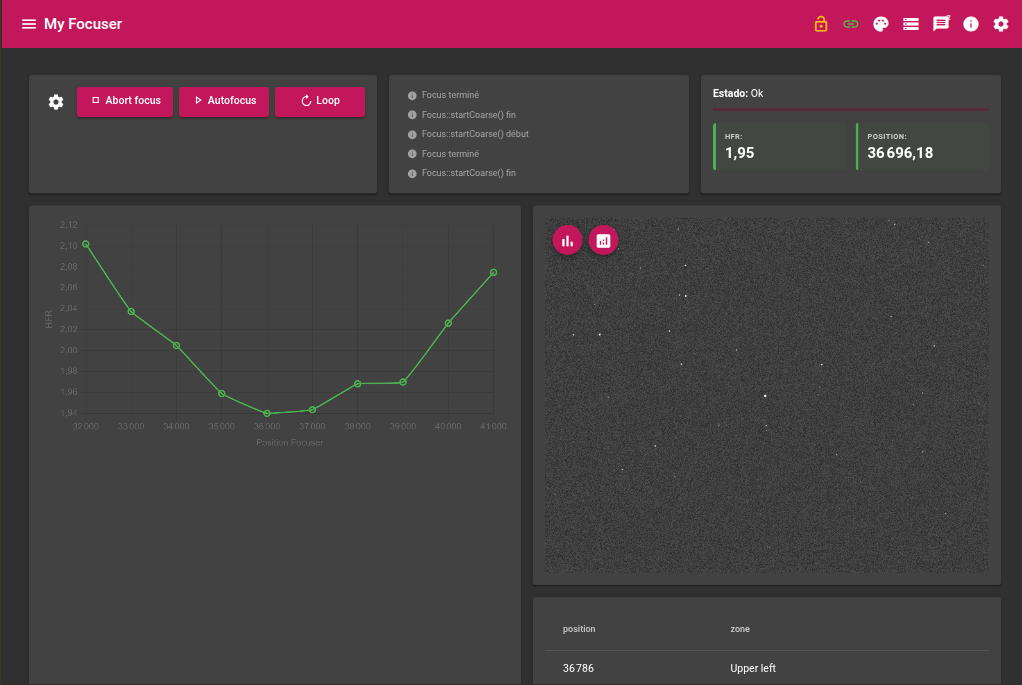
The HFR chart is drawn with error bars representing the standard deviation of measurements at each position, and the polynomial fit appears as a dashed orange line as acquisitions proceed.
Required devices
| Device | Role |
|---|---|
| Camera | Image acquisition for HFR measurement |
| Motorized focuser | Focus position control |
| Filter wheel | Optional — used if configured |
Parameters
These parameters are accessible from the module Parameters menu. A set of parameters can be saved as a profile.
Exposure
| Parameter | Description |
|---|---|
| Exposure | Exposure duration in seconds |
| Gain | Camera gain |
| Offset | Camera offset |
Focus
| Parameter | Description |
|---|---|
| Start position | Absolute focuser position to begin the sequence (ignored if Focus around current is enabled) |
| Focus around current | Automatically centres the sequence around the current focuser position: current_pos − (step × iterations / 2) |
| Step | Gap in focuser units between two consecutive measurements |
| Iterations | Number of measurement points. With 5 iterations and a step of 2000, the focuser explores a range of 8000 units |
| Backlash | Overshoot applied before each movement to compensate mechanical play. The focuser moves back by this value before advancing to the target |
| Zoning | Divides the image into zones (1×1 to 9×9). See dedicated section below |
Algorithm
Focusing proceeds in two phases.
Phase 1 — Exploration
- The focuser moves to
start_position − backlash(mechanical play compensation) - It advances to
start_position - For each iteration:
- Camera frame reset
- Frame acquisition, computation of HFR and its standard deviation
- Recording of the triplet (position, HFR, std dev)
- Real-time update of the polynomial fit
- Advance by one step
The degree-2 polynomial fit continuously provides the minimum of the HFR curve:
optimal_position = −k1 / (2 × k2) [for k0 + k1·x + k2·x²]Phase 2 — Final positioning
- The focuser moves back to
best_position − backlash - It advances to the optimal position computed by the polynomial
- A final frame is acquired to measure the resulting HFR
The retained optimal position is the polynomial fit result (bestposfit). If the fit could not be computed (fewer than 3 points), the best directly measured position (bestpos) is used instead.
HFR chart
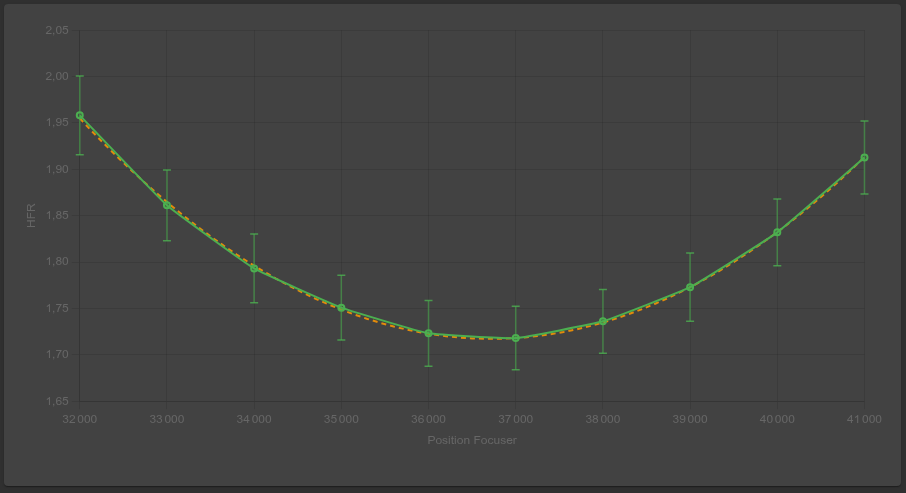
The HFR chart is drawn in real time during the exploration phase and updated at each measurement point. It contains two overlaid elements:
- Measured points (green) with error bars representing ±1 standard deviation of measurements at each position
- Polynomial curve (dashed orange) — degree-2 fit updated at each new point
The X axis represents the absolute focuser position, the Y axis the HFR in pixels.
The displayed standard deviation reflects the spread of individual per-star HFR values measured at a given focus position. A wide error bar indicates variable seeing or significant turbulence at acquisition time.
Zoning
Zoning divides the image into an N×N grid and computes an independent polynomial fit for each zone. It enables both a fine analysis of HFR variations across the field and a sensor tilt map.
| Value | Grid | Use case |
|---|---|---|
| 1 | 1×1 | No zoning — single global measurement |
| 2 | 2×2 | Basic tilt detection (4 quadrants) |
| 3 | 3×3 | Standard analysis — centre + edges + corners |
| 5 | 5×5 | Fine analysis |
| 9 | 9×9 | Very fine analysis — 81 zones |
For each zone, the module computes via Welford’s algorithm (single-pass incremental update):
- The mean HFR of the zone
- The HFR standard deviation of the zone — indicator of local optical quality
Sensor tilt mapping
When zoning is enabled (≥ 2×2), the module automatically generates four mapping images at the end of the sequence. Each represents the optimal focus position for each zone, colour-coded (blue = low position / near focal plane, red = high position / far focal plane).
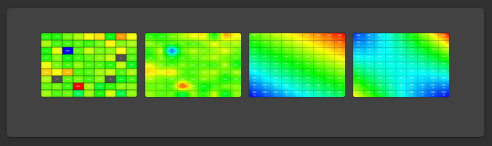
The width-to-height ratio of each image matches the actual sensor geometry.
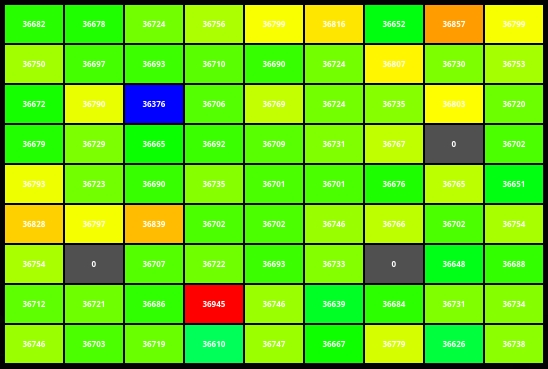
rawTilt — Raw per-zone tilt
Each zone is represented by a uniform colour block proportional to its best focus position. No interpolation — spatial resolution equals that of the zoning grid.
localTiltLinear — Local bilinear interpolation
Bilinear interpolation between adjacent zone centres. Produces a smooth map without any assumption about the global shape of the focal plane.
globalTiltLinear — Global plane fit (GSL linear regression)
Least-squares plane fit over all zone positions (GSL library). Ideal for quantifying pure tilt: inclination of the sensor relative to the optical axis. The residual shown in each cell (in yellow) is the deviation between the measurement and the fitted plane.
globalTiltQuadratic — Quadratic surface fit (GSL degree-2)
Degree-2 surface fit. Captures non-planar defects: field curvature, sensor flexion. The colour scale covers the true minimum and maximum of the surface (including the vertex if it lies within the sensor bounds).
- rawTilt / localTiltLinear: local diagnostics — useful for spotting an outlier zone caused by a bad star.
- globalTiltLinear: direct tilt measurement. If the gradient is uniform, tilting the sensor in the indicated direction will be sufficient to correct it.
- globalTiltQuadratic: if the global plane residual is large and the quadratic surface fits significantly better, field curvature or mechanical flexion is the likely cause.
Live values
| Value | Description |
|---|---|
| Status | Current sequence state (Idle / Running / Ok / Error) |
| Progress | Overall sequence progress bar |
| HFR | HFR measured at the final position |
| Position | Final focuser position |
Final result
At the end of the focusing sequence, the module publishes:
| Result | Description |
|---|---|
| Final position | Absolute focuser position after positioning |
| Final HFR | HFR measured at the optimal position |
These values are also published to other modules (sequencer) via the inter-module event system.
Actions
| Action | Description |
|---|---|
| Start focusing | Starts the complete sequence |
| Abort | Immediately stops the current sequence |